Talking about 'immigrants' in Trove's digitised newspapers
I’m giving a talk in a week or so (eep!) that looks at some of the changing contexts in which the word ‘aliens’ has been used in Australia. I thought, by way of comparison, it would be useful to do the same for ‘immigrants’. While I was playing around with the data last night, I came across something interesting, so here’s a sneak preview…
Getting the data
Using my TroveHarvester I downloaded the full text of all newspaper articles in Trove that included the word ‘immigrants’. I used the text: modifier to turn off stemming, and limited the results to the Article category. Here’s the query I used. After the harvest had finished, I had 505,296 text files to play with.
I then used a regular expression — [\w,]+(?=\s+immigrants) — to find words appearing before the word ‘immigrants’ in the text files. I found 642,447 occurences across those 505,296 articles.
Using Pandas I calculated the frequency of each word. Here’s a CSV with all the words that have a frequency greater than 100. There’s plenty of OCR errors in the mix of course, I haven’t tried any cleaning up.
Hmm, that’s interesting
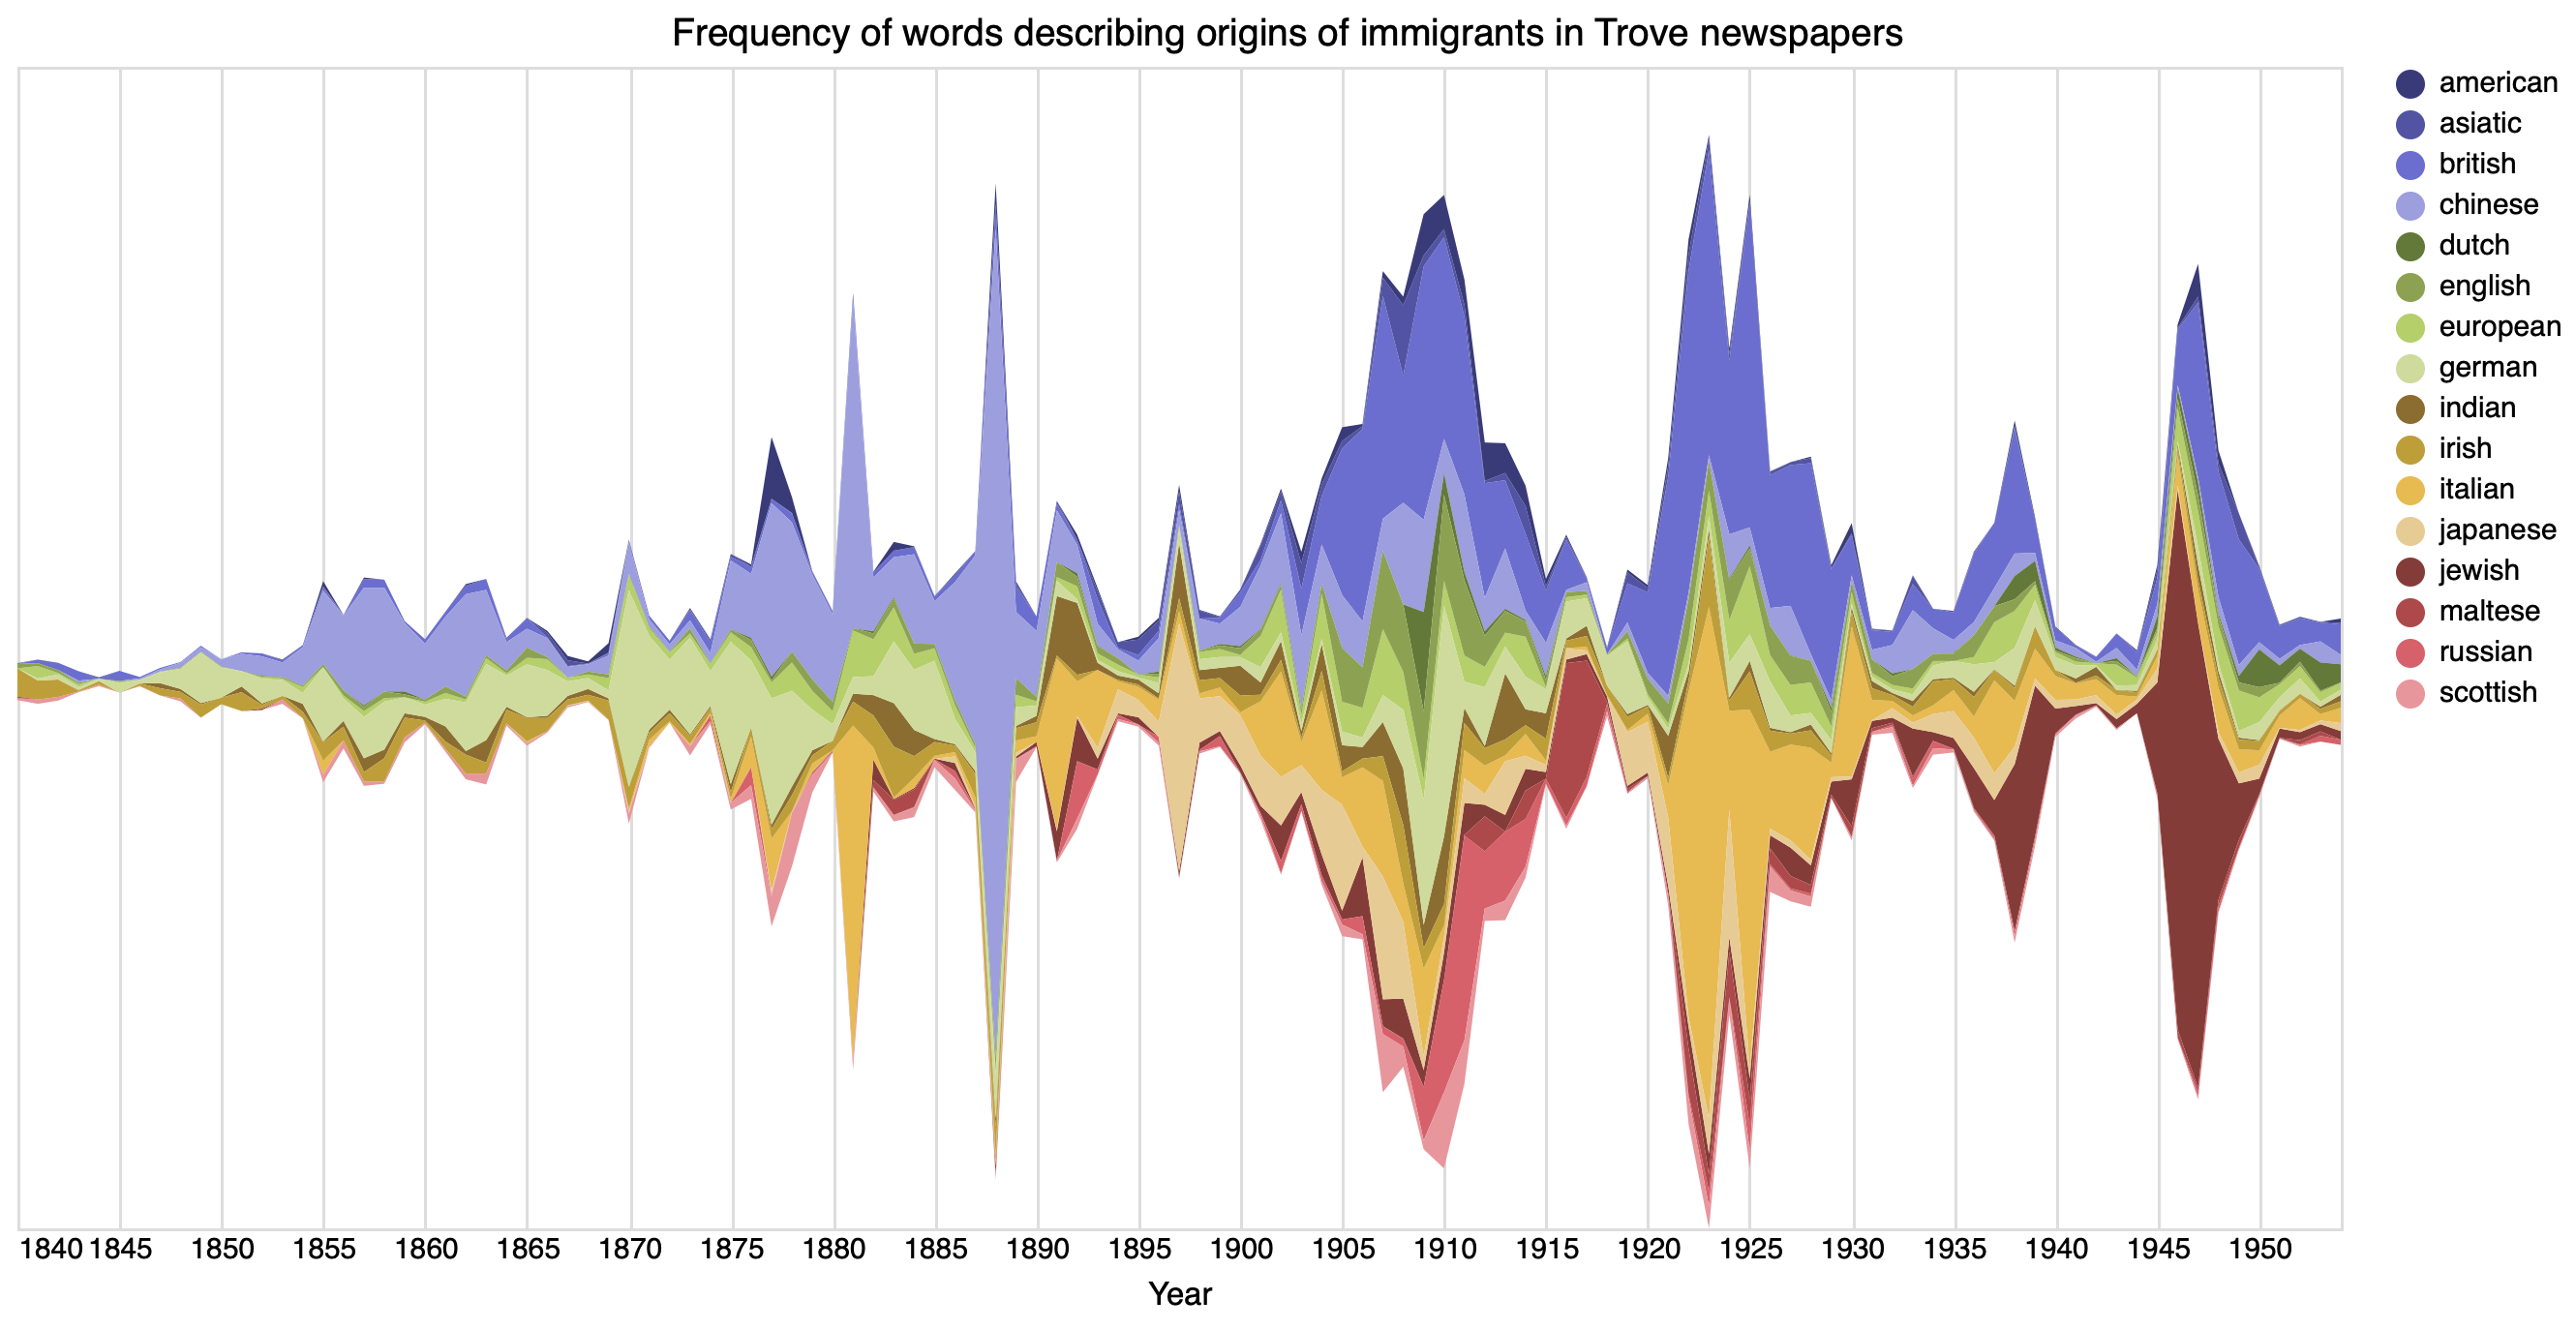
For my talk I’ll be looking at words like ‘undesirable’ and ‘prohibited’, but the thing that struck me last night were the words describing the ethnic origins of immigrants — ‘Chinese’, ‘German’, ‘British’ etc. I thought I’d have a go at visualising how the use of these terms varied over time. The chart below includes words with an overall frequency greater than 500. The only change I made to the categories was to merge ‘scotch’ and ‘scottish’.
It’s important to remember that this isn’t about the number of immigrants arriving in Australia, it’s a reflection of which groups of immigrants were being talked about, and when. So, for example, ‘Chinese immigrants’ feature prominently in newspapers of the 1880s as legislation is introduced to restrict their entry to the Australian colonies.
If you’d like a larger version of this chart, you can download it here.
