8 million Trove tags to explore!
I’ve always been interested in the way people add value to resources in Trove. OCR correction tends to get all the attention, but Trove users have also been busy organising resources using tags, lists, and comments. I used to refer to tagging quite often in presentations, pointing to the different ways they were used. For example, ‘TBD’ is a workflow marker, used by text correctors to label articles that are ‘To Be Done’. My favourite was ‘LRRSA’, one of the most heavily-used tags across the whole of Trove. What does it mean? It stands for the Light Rail Research Society of Australia, and the tag is used by members to mark items of shared interest. It’s a great example of how something as simple as plain text tags can be used to support collaboration and build communities.

Until its update last year, Trove used to provide some basic stats about user activity. There was also a tag cloud that let you explore the most commonly-used tags. It’s now much harder to access this sort of information. However, you can extract some basic information about tags from the Trove API. First of all, you can filter a search using ‘has:tags’ to limit the results to items that have tags attached to them. Then to find out what the tags actually are, you can add the include=tags parameter. This embeds the tags within the item record, so you can work through a set of results, extracting all the tags as you go. To save you the trouble, I’ve done this for the whole of Trove, and ended up with a dataset containing more than 8 million tags!

The dataset is saved as a 500mb CSV file, and contains the following fields:
tag– lower-cased version of the tagdate– date the tag was addedzone– the API zone that contains the tagged resourceresource_id– the identifier of he tagged resource
There’s a few things to note about the data:
- Works (such as books) in Trove can have tags attached at either work or version level. This dataset aggregates all tags at the work level, removing any duplicates.
- A single resource in Trove can appear in multiple zones – for example, a book that includes maps and illustrations might appear in the ‘book’, ‘picture’, and ‘map’ zones. This means that some of the tags will essentially be duplicates – harvested from different zones, but relating to the same resource. Depending on your interests, you might want to remove these duplicates.
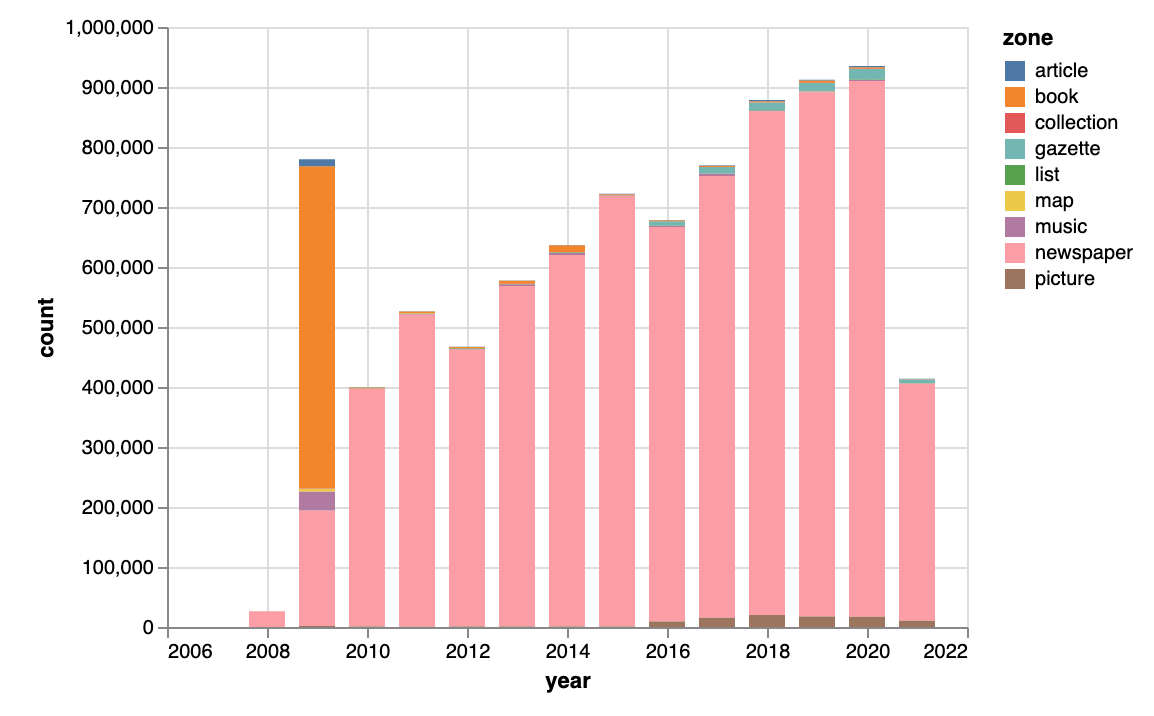
- While most of the tags were added by Trove users, more than 500,000 tags were added by Trove itself in November 2009. I think these tags were automatically generated from related Wikipedia pages. Depending on your interests, you might want to exclude these by limiting the date range or zones.
- User content added to Trove, including tags, is available for reuse under a CC-BY-NC licence.
You can download the complete dataset from Zenodo, or from CloudStor. For more information on how I harvested the data, and some of its limits and complexities, see the notebooks in the new ‘Tags’ section in the GLAM Workbench. There’s also some examples of analysing and visualising the tags. As an extra bonus, there’s a more compact 50mb CSV dataset which lists each unique tag and the number of times it has been used.
Of course, it’s worth remembering that this sort of dataset is out of date before the harvest is even finished. More tags are being added all the time! But hopefully this data will help us better understand the way people work to organise and enrich complex resources like Trove. #dhhacks