Tracking Trove changes over time
I’ve been doing a bit of cleaning up, trying to make some old datasets more easily available. In particular I’ve been pulling together harvests of the number of newspaper articles in Trove by year and state. My first harvests date all the way back to 2011, before there was even a Trove API. Unfortunately, I didn’t run the harvests as often as I should’ve and there are some big gaps. Nonetheless, if you’re interested in how Trove’s newspaper corpus has grown and changed over time, you might find them useful. They’re available in this repository and also in Zenodo.
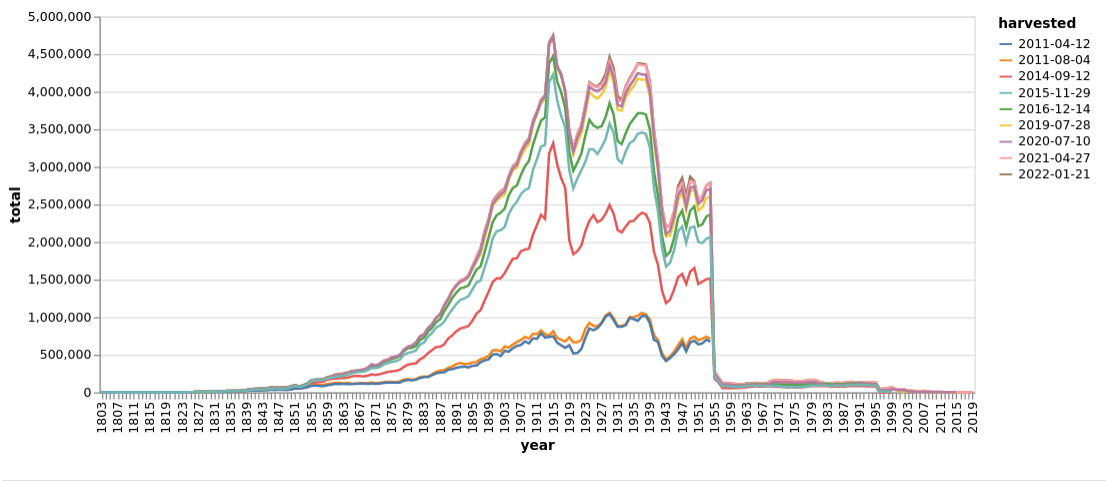
This chart shows how the number of newspaper articles per year in Trove has changed from 2011 to 2022. Note the rapid growth between 2011 and 2015.
To try and make sure that there’s a more consistent record from now on, I’ve also created a new Git Scraper – a GitHub repository that automatically harvests and saves data at weekly intervals. As well as the number of articles by year and state, it also harvests the number of articles by newspaper and category. As mentioned, these four datasets are updated weekly. If you want to get all the changes over time, you can retrieve earlier versions from the repository’s commit history.
All the datasets are CC-0 licensed and validated with Frictionless.
There’s also a notebook in the GLAM Workbench that explores this sort of data.