Maps, people, lists & more – recent updates to Trove resources in the GLAM Workbench
Once again I’ve gotten a bit behind in noting GLAM Workbench updates, so here’s a quick catch up on some Trove-related changes from the last couple of months.
Trove API introduction
The section that introduces the Trove API (or APIs!) hasn’t had much love over recent years. I’m hoping to add some more content in the coming months, but for now I just did a bit of maintenance – updating Python packages and config files, including tests, and setting up automated builds of Docker containers. The documentation pages have also had a bit of a refresh. More soon!
Trove lists and tags
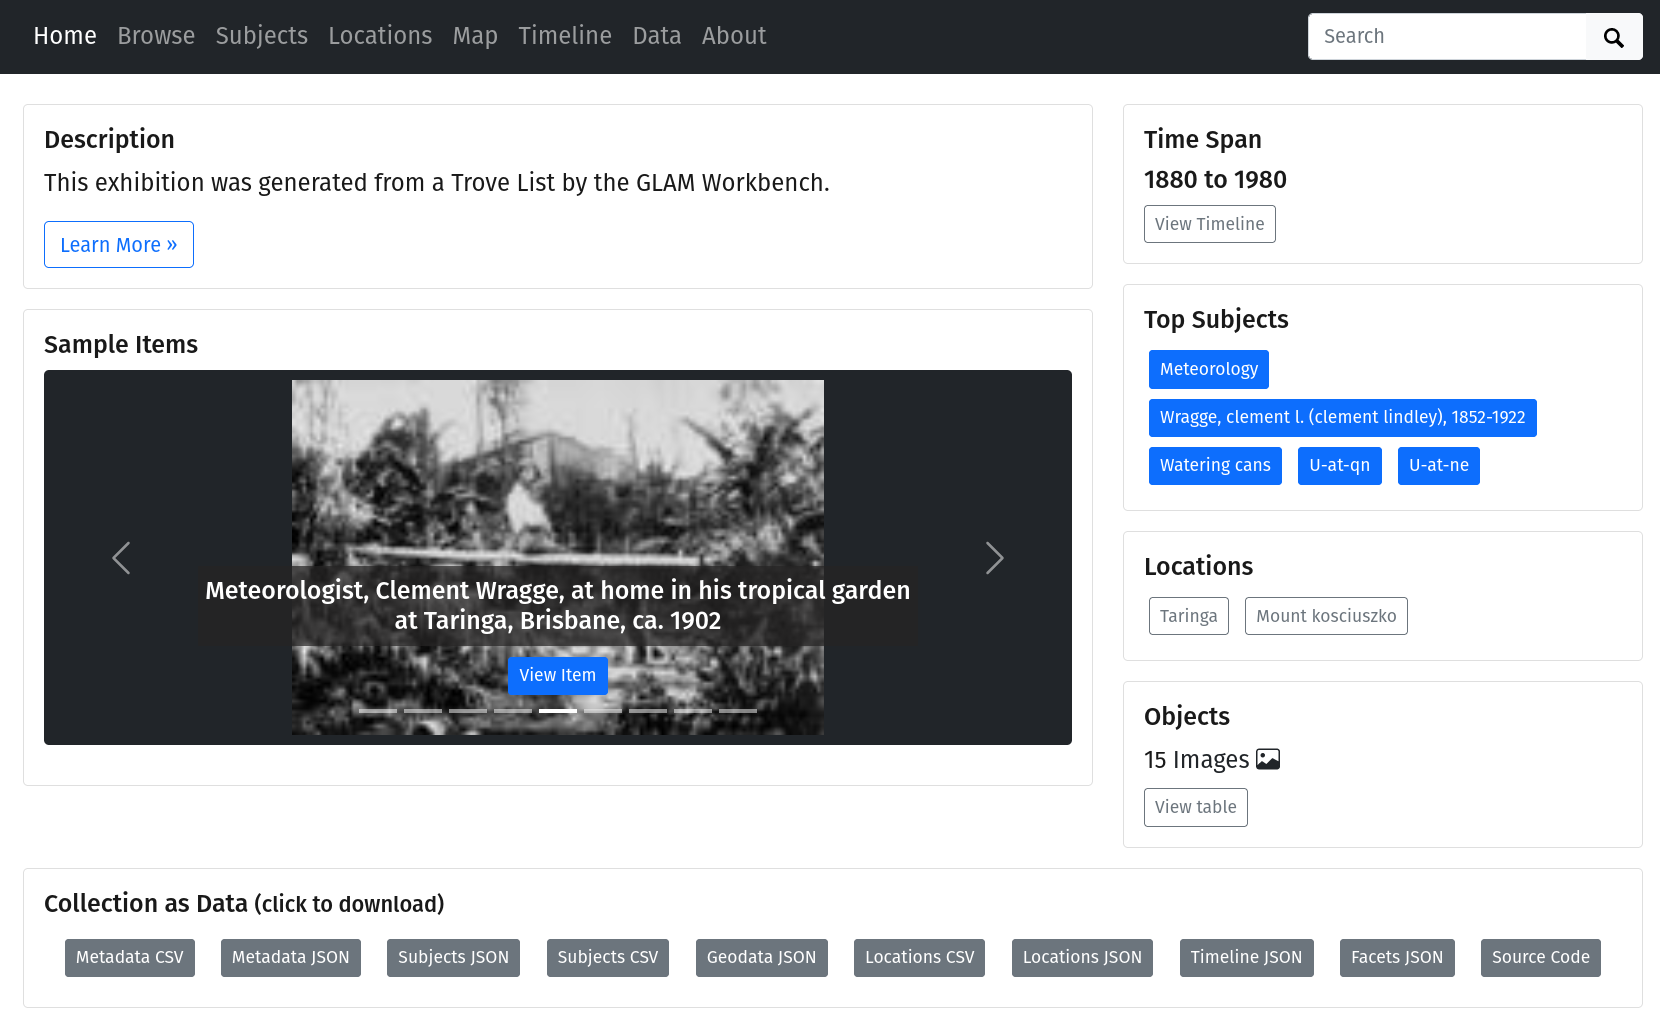
For the Everyday Heritage digital workshop last November, I added a new notebook to convert a Trove list into a CollectionBuilder exhibition. The notebook harvests metadata and images from the items in a Trove list, then packages everything up in a form that can be uploaded to a CollectionBuilder-GH repository. Just upload the files to create your own instant exhibition! For example, this exhibition was generated from this Trove list.
More recently, I updated and reorganised the documentation pages. In particular, I updated the links to the pre-harvested datasets which are now all saved in Zenodo:
These datasets have also been added to the Trove historical data collection in Zenodo.
Trove maps
The Trove Maps section also needed a refresh and rebuild. The existing notebook harvested metadata about digitised maps to build an overview of what was available. I updated the harvesting code to capture a bit more information, including spatial coordinates where available. These coordinates aren’t available through the API, and aren’t visible on a map’s web page, but they are embedded within the HTML (this is a little trick I’ve used with other digitised materials to get additional metadata). You can download the updated dataset.
I also added a new notebook that attempts to parse the spatial data strings and convert the coordinates into decimal values that we can display on a map. Some of the coordinates were bounding boxes, while others were just points. If there was a bounding box, I calculated the centre point and saved that as well. I ended up with decimal coordinates for 26,591 digitised maps. You can download the parsed and converted coordinates as a dataset.
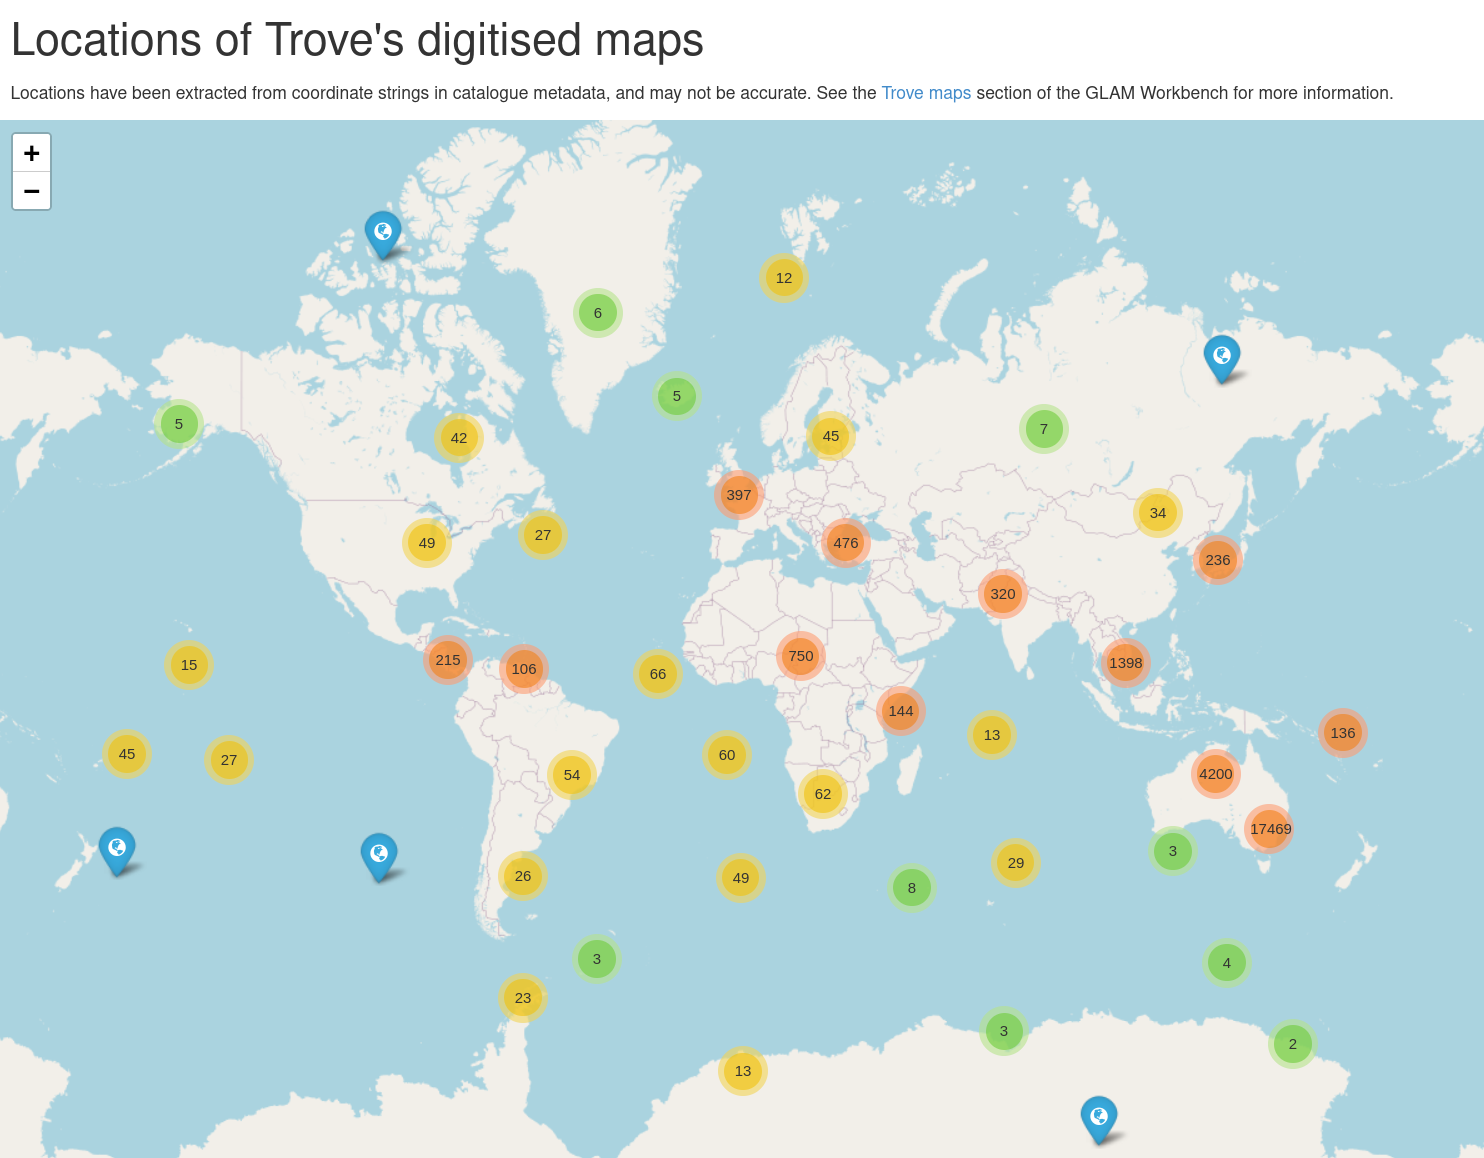
From this data I was able generate some interesting visualisations. I used Folium and the FastMarkerCluster plugin to map all of the centre points. I’ve had trouble before displaying lots of markers in Jupyter, but FastMarkerCluster handled it easily. I also saved the Folium map as a HTML page to make it easy for people to explore. Just zoom around and click on markers to display the map’s title and a link to Trove.
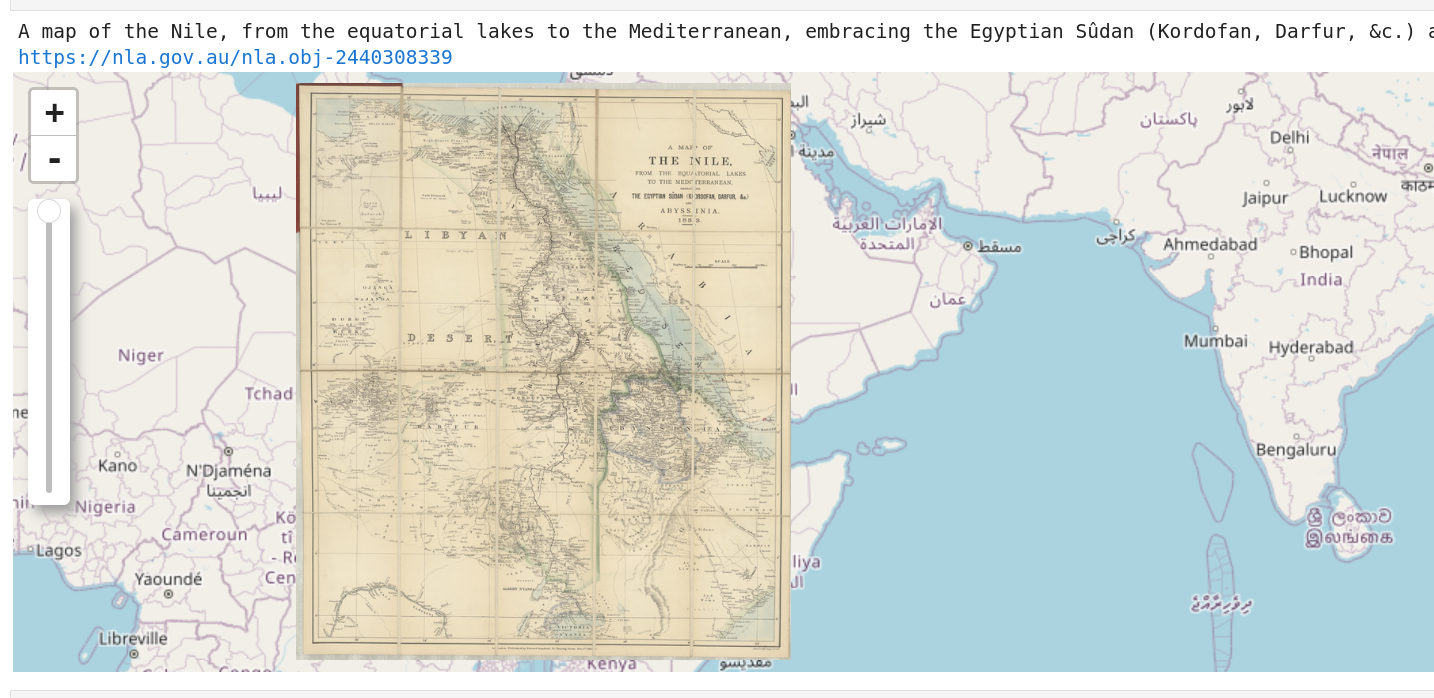
Where there are bounding boxes, you can overlay the map images themselves on a modern map. Of course, this isn’t as accurate as georectifying the map, particularly if the map doesn’t fill the whole image, but it’s still pretty fun. There’s a demonstration in the notebook that selects a random map and overlays the image on a modern basemap using IPyleaflet. It includes a widget to adjust the opacity of the map image (something I didn’t seem to be able to include using Folium?).
Trove People & Organisations
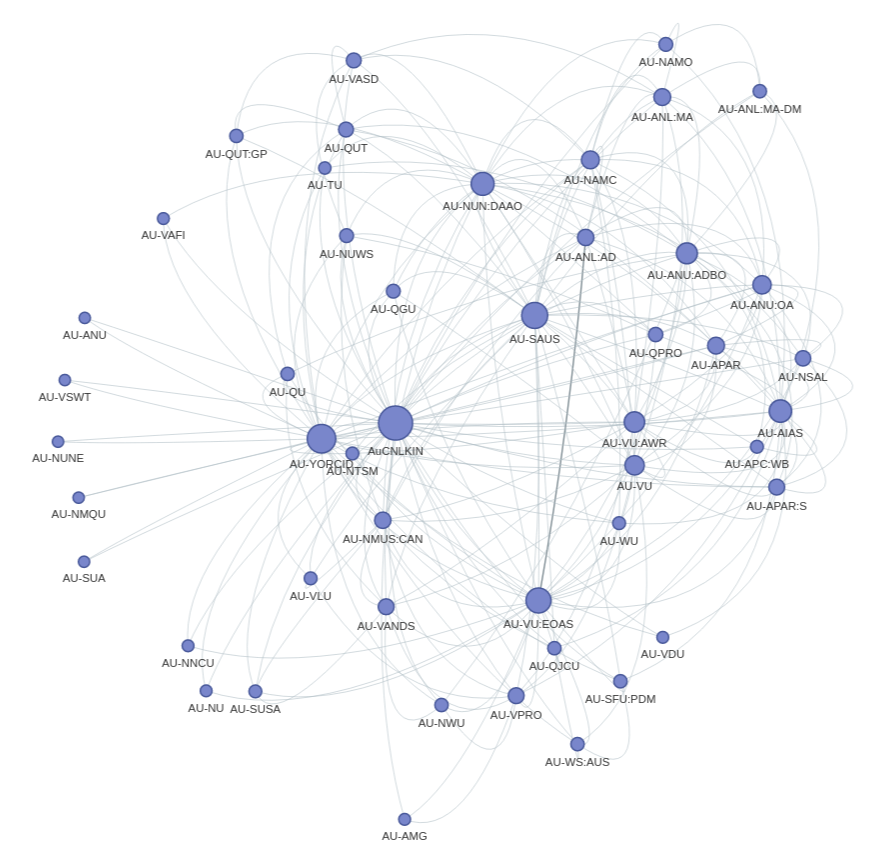
I’ve finally added a section for the Trove People & Organisations zone! This has been in the works for a while, but thanks to the Australian Cultural Data Engine I was able to devote some time to it. Trove’s People and Organisations zone aggregates information about individuals and organisations, bringing multiple sources together under a single identifier. Data is available from a series of APIs, which are not well-documented. The notebooks show you how to harvest all the available people and organisations data as EAC-CPF encoded XML files. Once you have the data, you can extract some summary information about sources and occupations, and use this to explore the way that records from different sources have been merged into unique identities. For example you can create a network graph of relationships between sources.
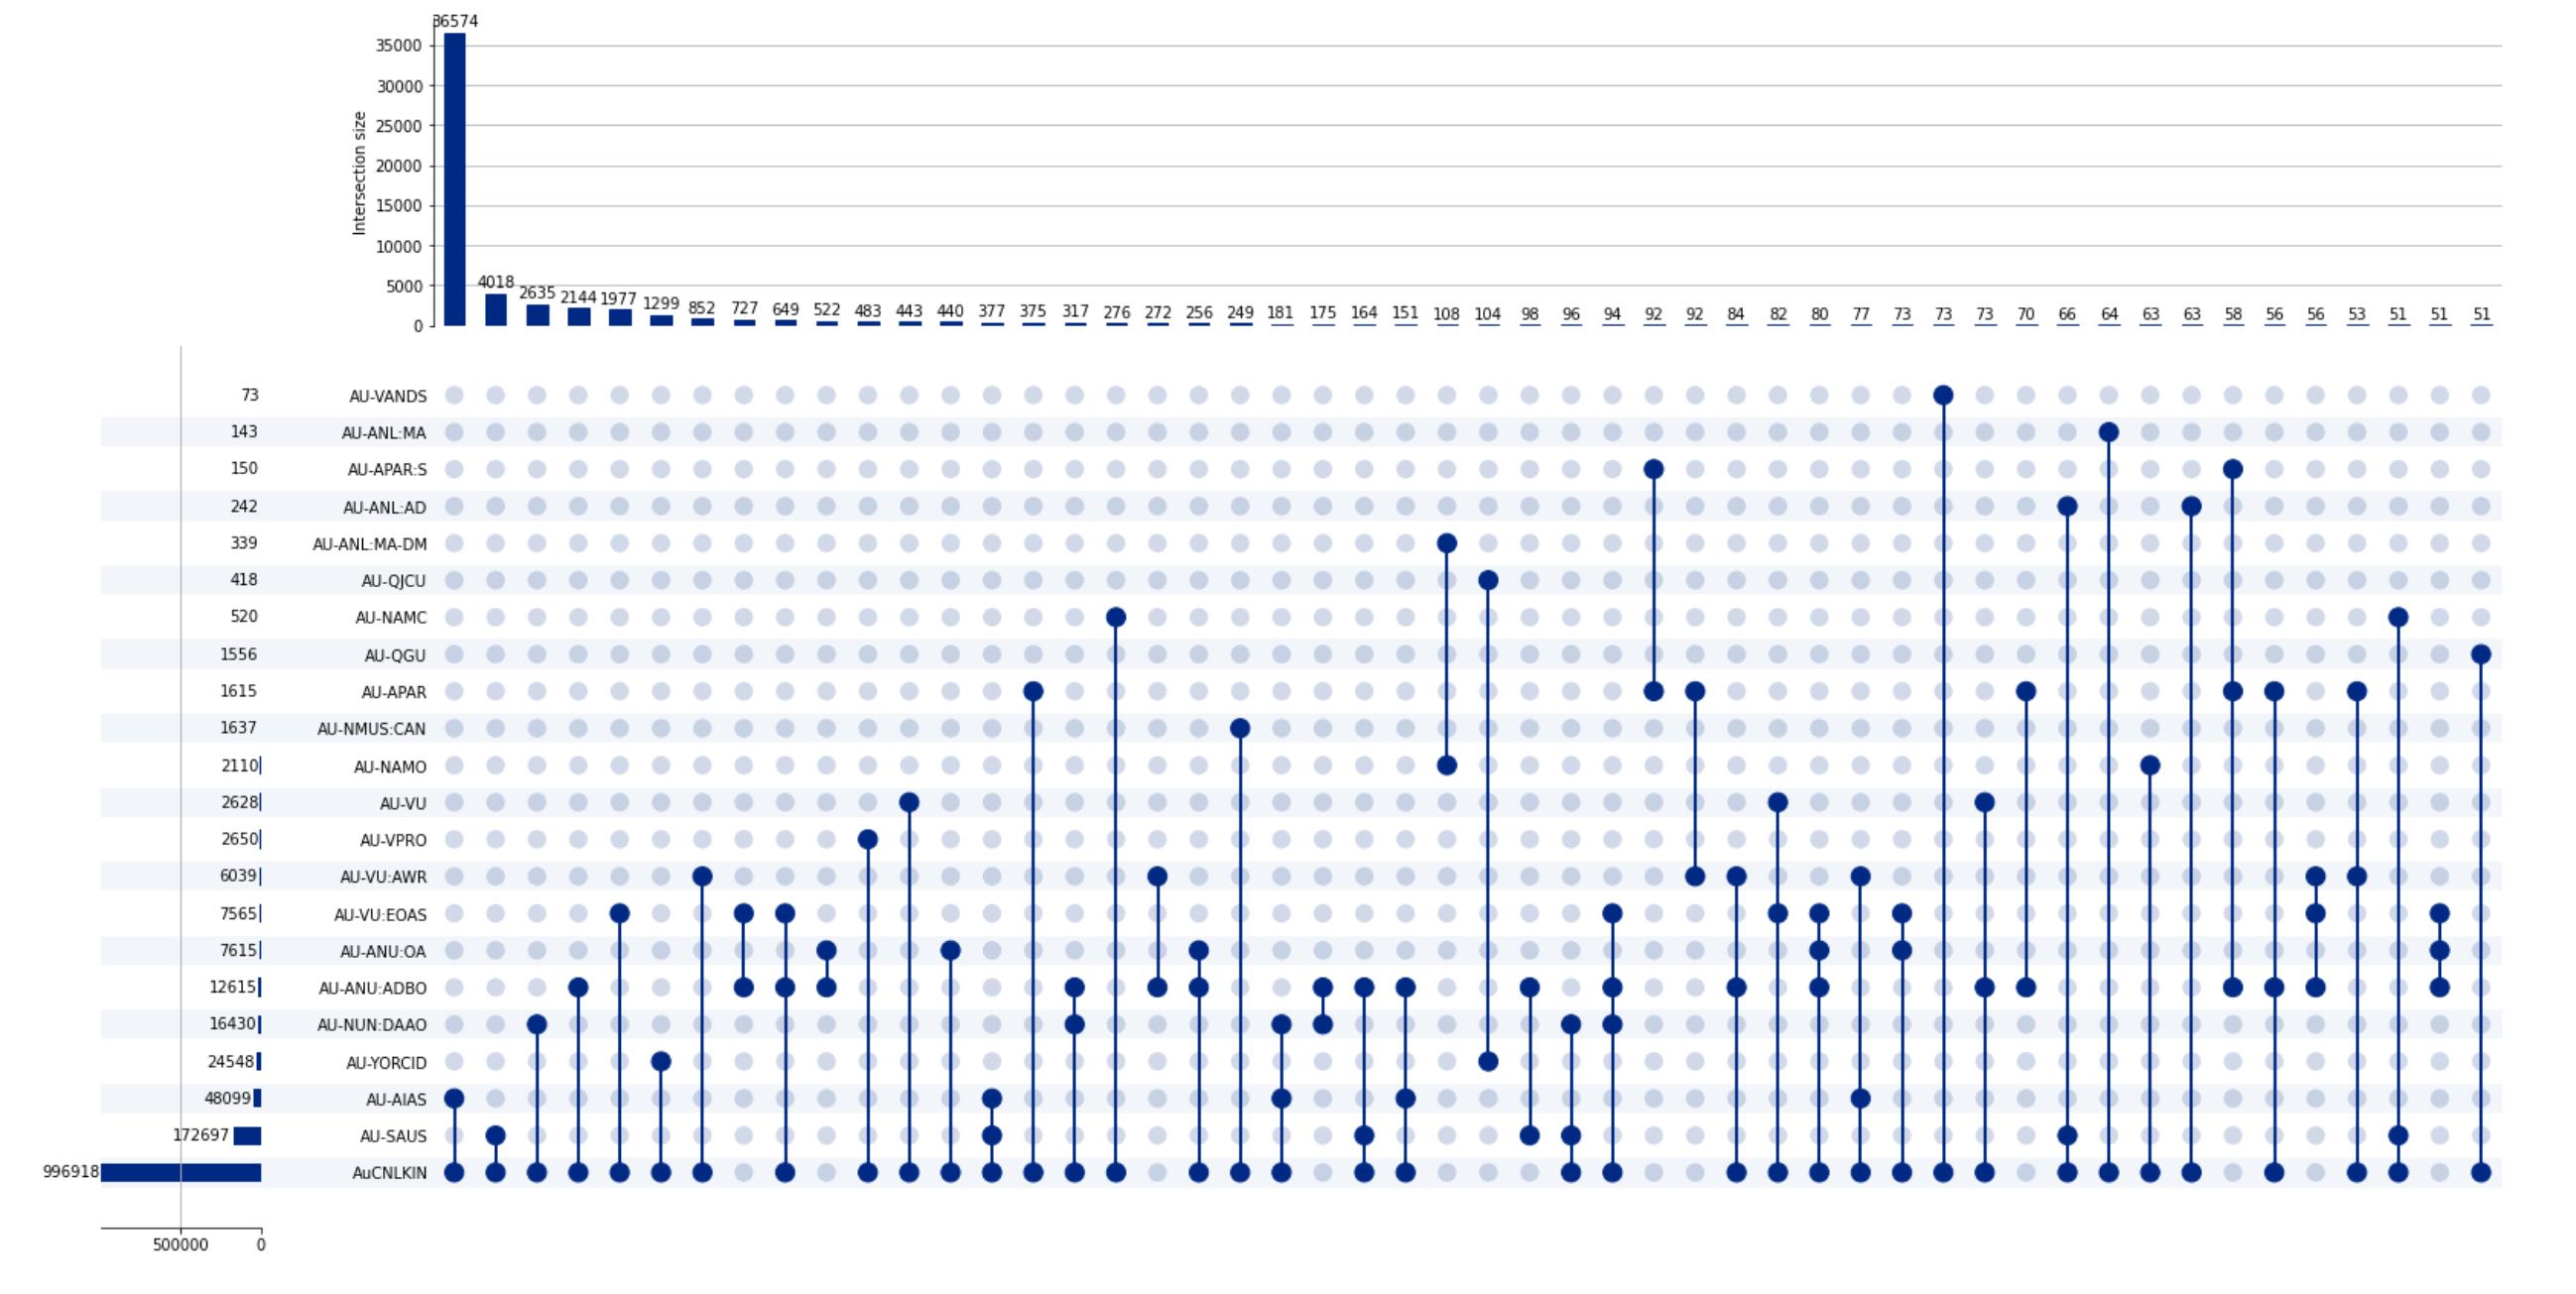
Or use an UpSet chart to show the most common groupings of sources.
There’s also a couple of notebooks with some handy examples of code to convert the XML results from the SRU API to JSON, and to find extra identity links through VIAF. I’ve also shared a pre-harvested version of the complete dataset and the extracted summaries.