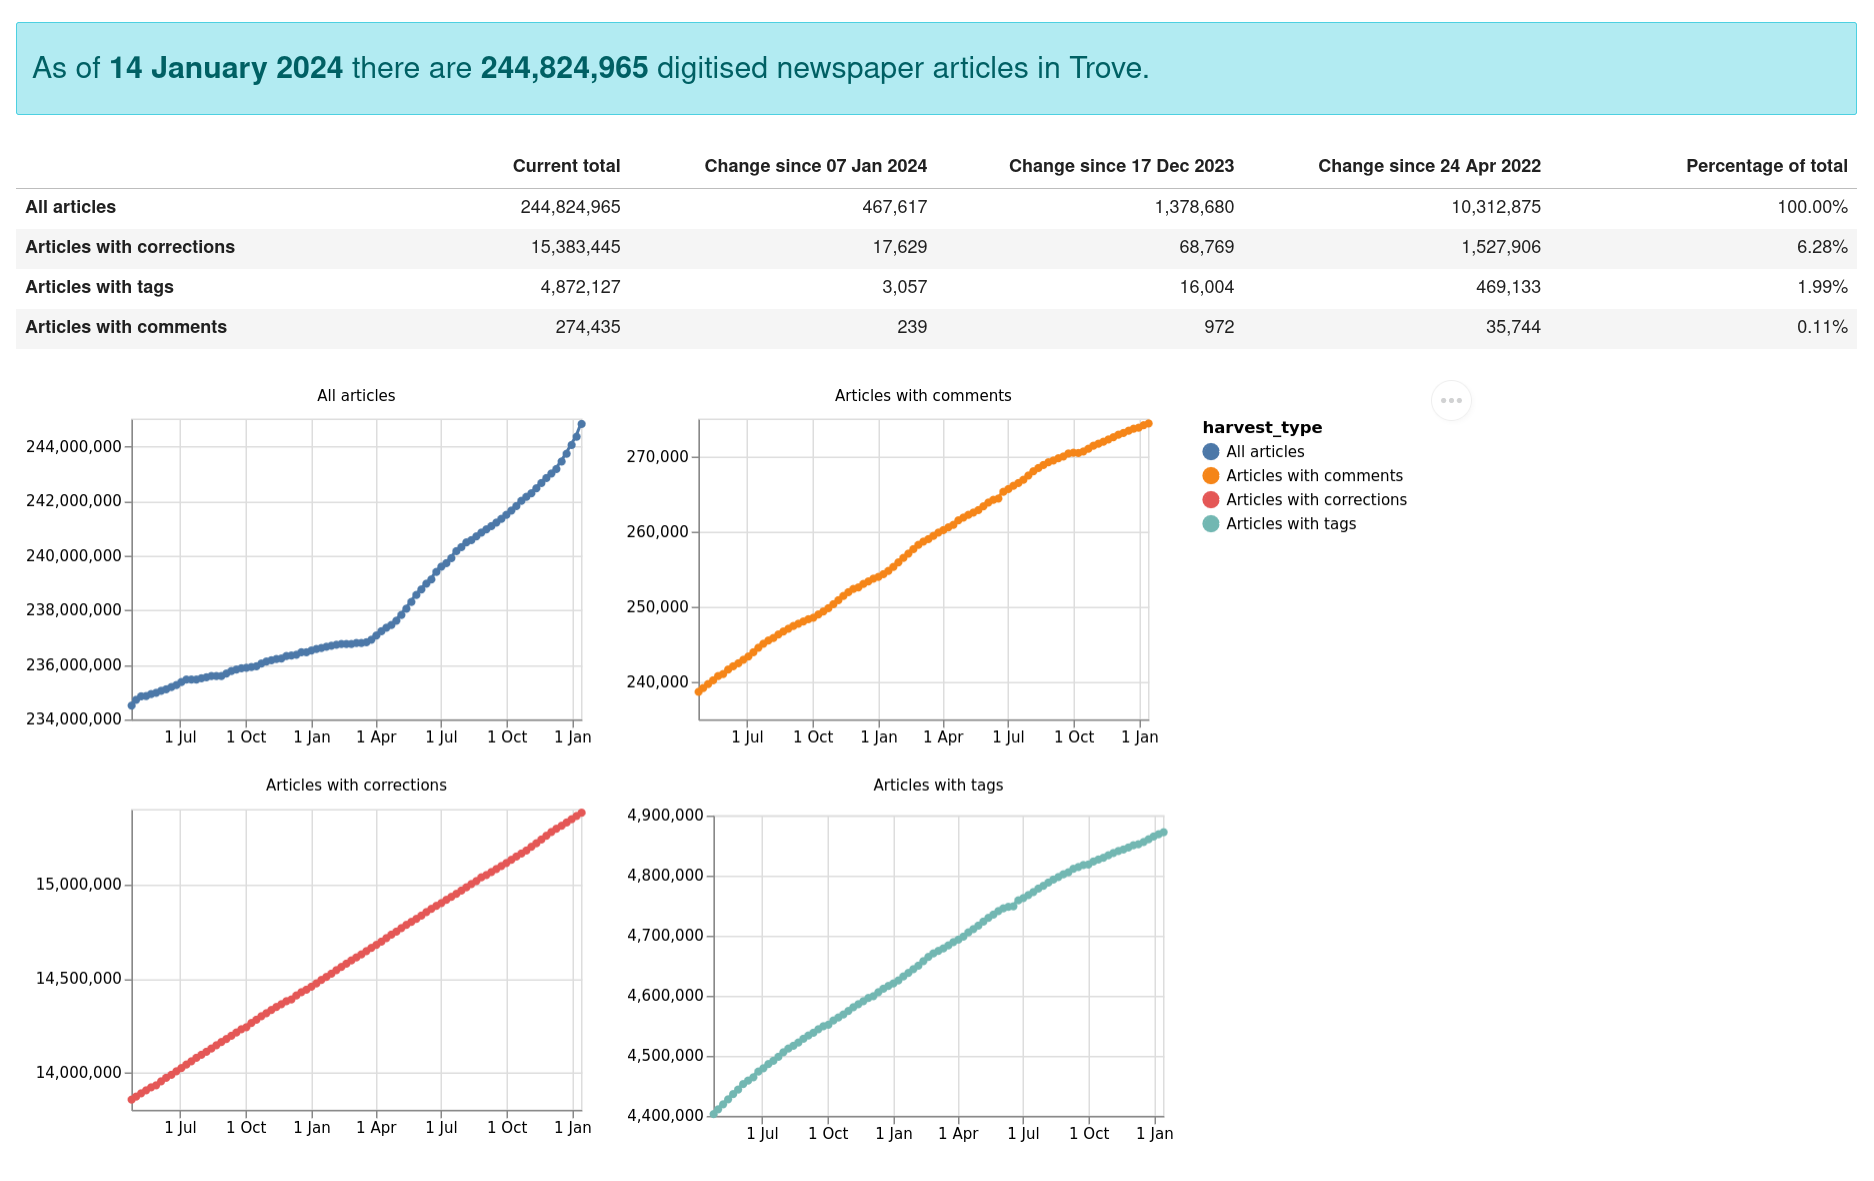
The Trove Newspaper Data Dashboard now has an archive!
Since July 2022 I’ve been generating weekly snapshots of the contents of the Trove newspaper corpus. Every Sunday a new version of the Trove Newspaper Data Dashboard is created, highlighting what’s changed over the previous week, and visualising trends since April 2022 (when I first started regular data harvests).

All of the past versions of the dashboard are preserved in GitHub, but there wasn’t an easy way to browse them, until now. If you want to find out what changed in any week since July 2022, you can now visit the Trove Data Dashboard Archive and select a date from the list!
I created the archive by pulling all the versions from GitHub and saving them as individual files. I’ve also added some code to the weekly process that should automatically archive the past week from now on – we’ll see if it works next Sunday…